
Getting started
Running your first scan
Starting a scan, what happens while it runs, and how to read the result when it finishes.
Starting a scan
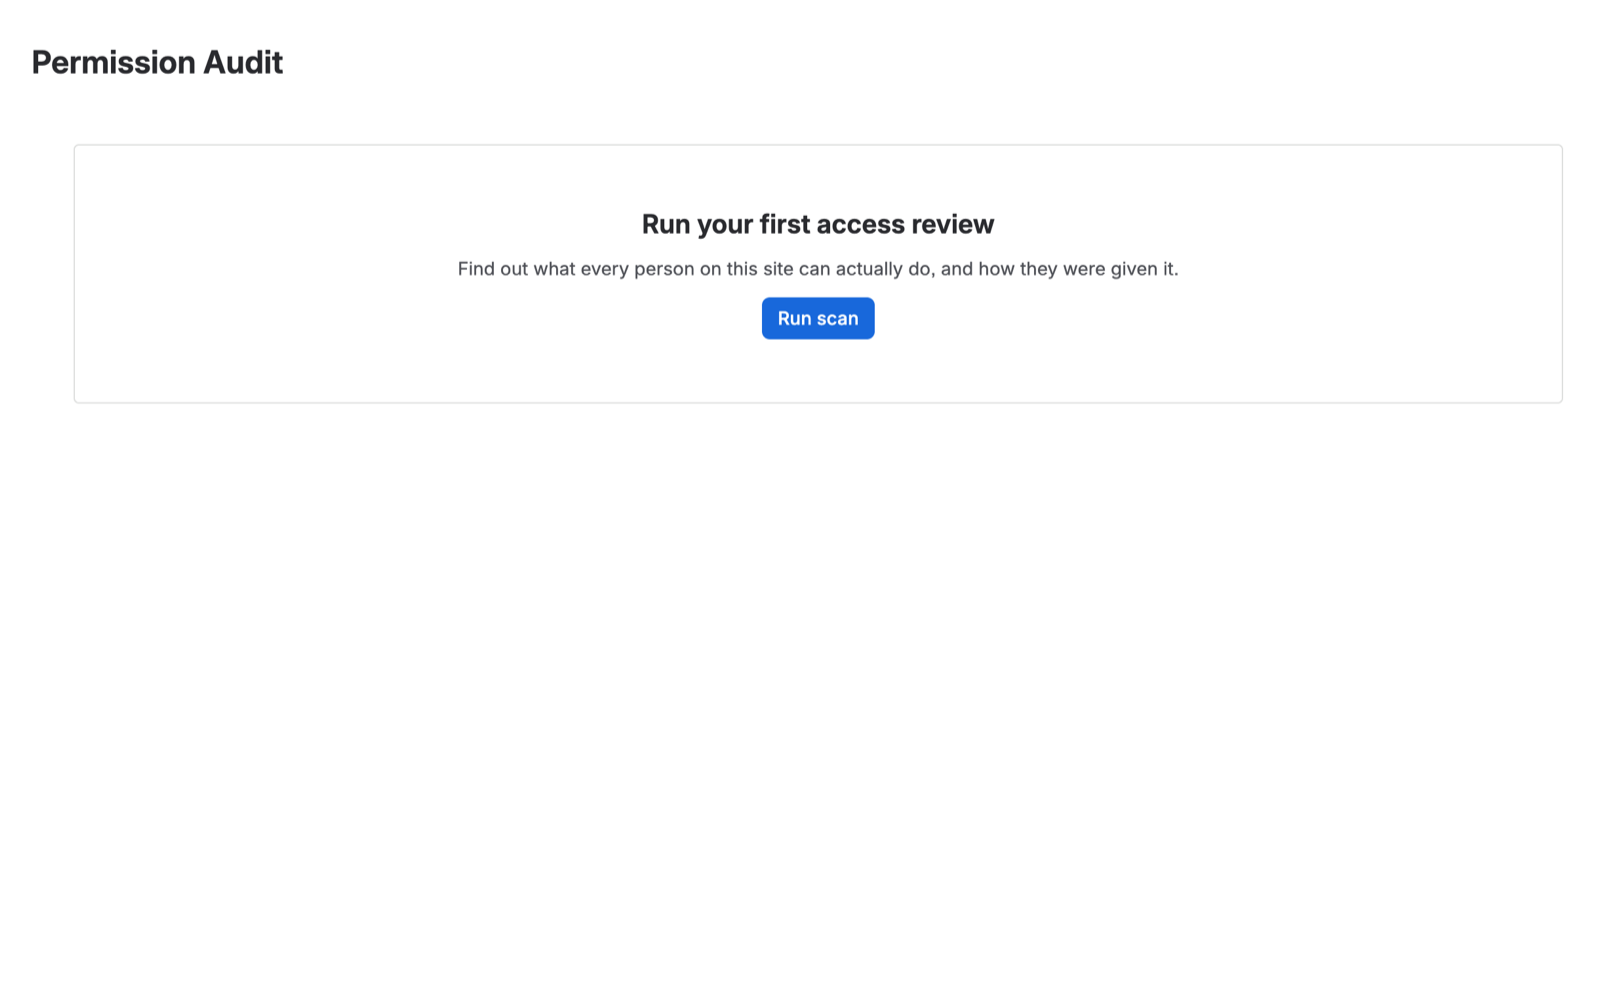
Open the app from Jira Settings → Apps → Permission Audit and choose Scan again in the page header. On a site that has never been scanned, the Overview tab shows an empty state with the same action.
What happens while it runs
The scan runs server-side, in chunks, and reports progress as a percentage.
You can close the tab. The scan is not driven by your browser, so navigating away, logging out, or closing the laptop does not stop it or lose the work already done. Come back and the progress indicator picks up where the scan actually is.
How long a first scan takes depends on the size of the estate — the number of projects, the number of distinct permission schemes, and the size of the groups those schemes grant to. A small site is a minute or two. A site with several hundred projects takes meaningfully longer, and this is the one scan that has to read everything; see Scan cost and quota for why subsequent scans are much cheaper.
When it finishes
The Overview tab shows the result. Three things to read first, in this order:
1. The coverage line
Directly under the page header, before the tabs. It answers “can I trust the rest of this page?”, and it is the first thing an auditor should read.
- Complete coverage — every permission scheme, project role, and group was read successfully. The report below is the whole answer.
- Partial coverage — something could not be read, and the banner names what. Anything derived from the missing piece is missing too.
Partial coverage is loud on purpose. A confident report built on a partial scan is the single most dangerous thing a compliance tool can produce, so the app would rather tell you it fell short than quietly show you less than the truth. If you see it, go to Activity to see exactly what was skipped and why.
2. The at-a-glance row
Five counts describing the shape of the site: people, installed apps that can act, accounts holding sensitive permissions, deactivated accounts that still have access, and projects no account can reach.
3. The findings
The cards below the counts are the reason most people opened the app. Each one is a list you can act on rather than a number you have to go investigate.
Then look at one person
The fastest way to understand what the report is actually telling you is to open a single account. Go to the People tab, pick anyone with access, and open them.
You will see every project they can reach and every permission they hold there — and for each grant, the route that produced it. That derivation is the product; see How access is derived.
Scanning again
Manual rescans are available from the page header at any time on Advanced. On Standard, one manual scan per rolling week is included — see Editions.
On Advanced, you generally will not need to press it. Continuous scanning is on by default, which keeps the report current on its own and records what changed between runs. See Continuous scanning.