
Using the report
Reading the report
The shell every report tab shares — coverage, the at-a-glance row, findings, and the activity log.
Every report screen shares the same shell: a page header with the scan actions, the coverage line beneath it, then tabs.
Coverage comes first
The coverage line sits above the tabs on every report screen, before anything else. That position is deliberate — it is the report’s honesty guarantee, and everything below it is conditional on it.
It carries the provenance of what you are looking at: when the scan ran, who ran it, and how much it covered.
Complete coverage means every permission scheme, project role, and group the scan needed was read successfully.
Partial coverage replaces the line with a warning banner naming what was missed, and a link through to Activity for the detail. Treat the affected areas as unknown, not as empty. A project whose scheme could not be read is not a project with no access; it is a project whose access is unmeasured, and the report says so rather than showing you a reassuring blank.

At a glance
| Count | What it means |
|---|---|
| People on the site | Every human account in the directory, split into those with access and those with none |
| Installed apps that can act | App principals holding at least one product permission, out of all installed apps |
| Sensitive permission holders | Accounts holding at least one permission marked sensitive in Settings |
| Deactivated with access | Deactivated accounts that still hold at least one grant |
| Unreachable projects | Projects that no account in the directory can reach at all |
Unreachable projects is the count people most often misread. It is not an error — it usually means a project whose permission scheme grants only to a role with no actors, or to a group with no members. It is worth investigating, because it is often an orphaned project nobody has noticed.
Findings
Three cards, each a list rather than a number:
Accounts with sensitive permissions. Which accounts hold one of the permissions marked sensitive in Settings, how many projects they hold it across, and the widest permission they hold. Fifteen permissions are marked sensitive by default; the set is configurable.
Deactivated people who still have access. Deactivated accounts holding at least one grant. On a healthy site this is empty, and the card says so plainly rather than showing a zero.
Widest access. The accounts that can reach the most projects. Not a finding in itself — a site administrator legitimately reaches everything — but the place where an unexpected name is worth a second look.
The tabs
| Tab | What it holds |
|---|---|
| Overview | Coverage, the at-a-glance row, findings |
| People | Every human account, sortable, with detail pages |
| Apps | Every installed app principal that can act (Advanced) |
| Projects | Every project, with who can reach it |
| Activity | The run log — every scan, what it covered, what it skipped |
| Settings | Sensitive permissions, review flags, export columns, continuous scanning |
Every list has a per-page selector — 10, 25, 50, or 100 rows, defaulting to 10.
Activity
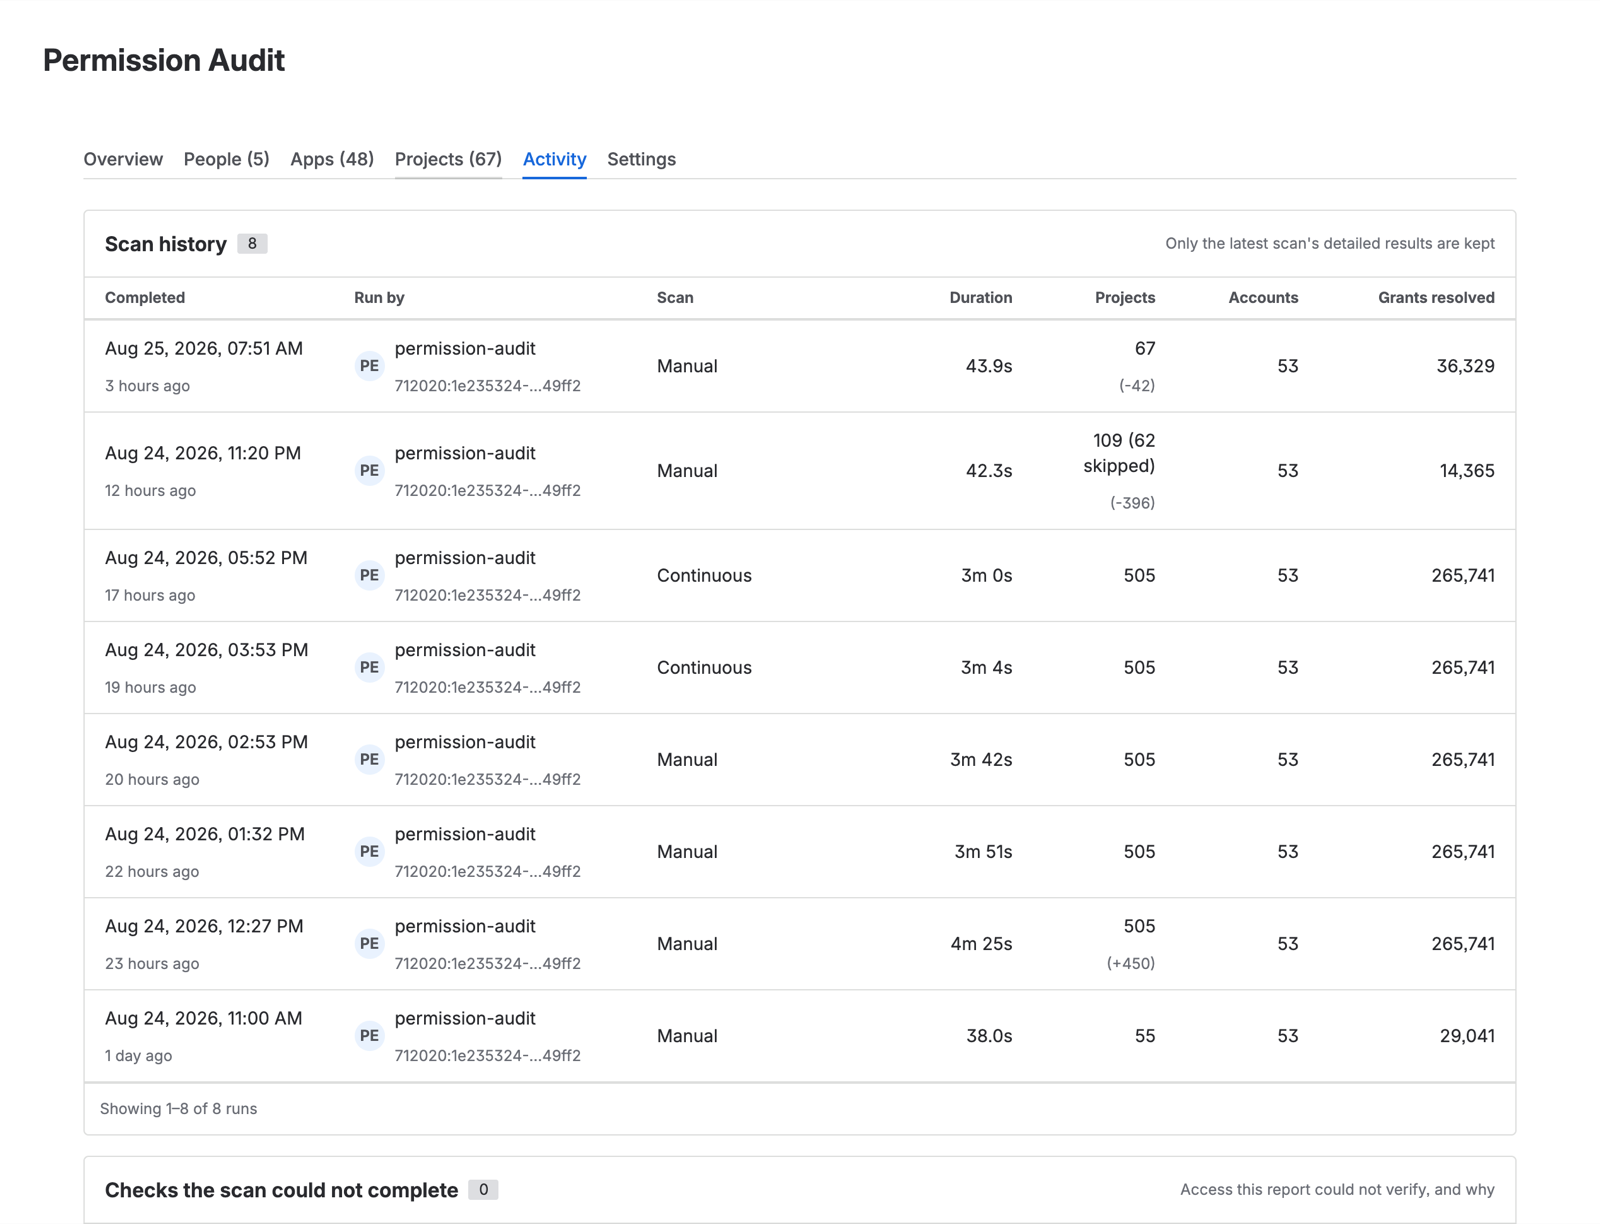
The run log records every scan that completed: when it ran, who ran it, how long it took, what it covered, and what it skipped and why.
The Scan column distinguishes a full pass from an incremental continuous run from a manual scan, and names the reason when a run that was meant to be incremental fell back to a full pass.
This is the tab to open when the coverage line said “partial”. The skipped items are listed individually with the reason each one failed, which is usually enough to tell whether it was a transient API failure worth rescanning or a configuration issue worth fixing.
A copy convention worth knowing
Throughout the report, an em-dash (—) means “not applicable or not measured” and a zero means “measured, and the answer is zero”. They are different statements and the report never conflates them. Where a card is empty because the scan genuinely verified there was nothing to show, it says what was verified rather than showing a blank.